Kosi Okeke · Dallas, TX

Complex data.
Clear decisions.

I’m a Data & Reporting Analyst who turns complex operational data into trusted reporting for performance, quality, and regulatory decisions. I combine SQL development, Power BI, and Epic analytics with rigorous validation and data governance practices to help leaders identify gaps and prioritize improvements.

SQL / T-SQL   Data preparationPower BI   Decision supportExcel   Analysis & validationEpic   Operational reporting
01 — Selected work

Questions worth answering.

Case studies in quality, patient flow, and regulatory analytics, with dashboard recreations you can explore.

These case studies describe my professional work. Two browser-based dashboard recreations use fictional data to demonstrate the reporting approach; they do not show actual hospital results.

01 / CASE STUDYQUALITY & PATIENT FLOW

Hospitalist & provider performance scorecards

REAL PROJECT · EXPERIENCE CASE STUDY

Built an Epic dashboard from Reporting Workbench reports and SlicerDicer sessions to bring patient-flow and quality measures into one clinical reporting view.

Epic · Reporting Workbench · SlicerDicer · Radar dashboardsExplore case study ↗
03 / CASE STUDYCAPACITY & PATIENT FLOW

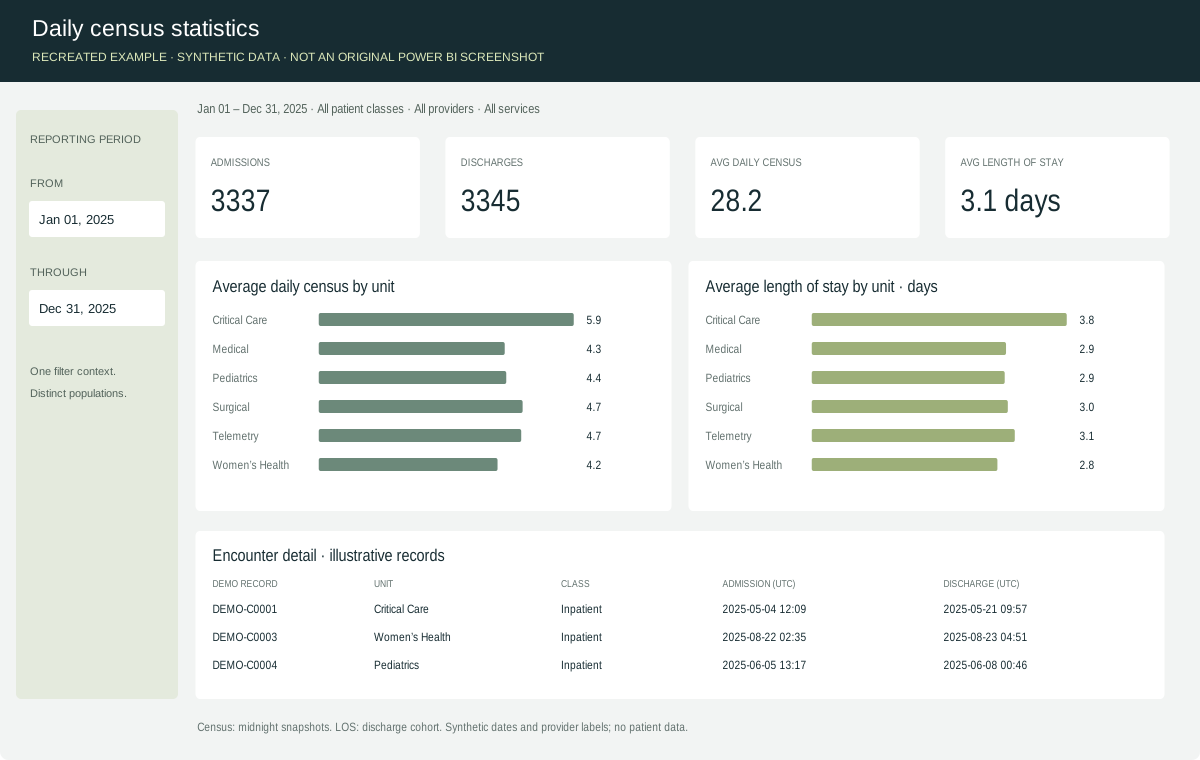
Daily census & discharge intelligence

REAL PROJECT + SYNTHETIC DASHBOARD RECREATION

Connected encounter-level activity with unit-level reporting across 12+ units, supporting operational review and DPHHS reporting.

SQL · Power BI · Excel · ReconciliationExplore case study ↗
04 / CASE STUDYEMS PERFORMANCE & CMS REPORTING

Ground ambulance performance & CMS reporting

REAL PROJECT · EXPERIENCE CASE STUDY

Turned years of ambulance event data into a service-area performance baseline and a CMS-ready Excel reporting deliverable.

Complex SQL · CTEs & joins · ExcelExplore case study ↗
02 — Behind the analysis

A technical foundation.
A practical perspective.

My work spans the reporting lifecycle: translating stakeholder requirements, developing SQL datasets, building dashboards, and reconciling results to source systems. I connect technical development with business context so leaders can understand what a metric measures, how it was calculated, and where it needs further investigation.

Within Epic, I develop Reporting Workbench reports and SlicerDicer content, bring individual measures into dashboards, and collaborate with Community Connect partners on reporting validation and release readiness.

Data governance is part of that approach: consistent metric definitions, traceable calculation logic, data quality checks, and clear reporting requirements. I collaborate with stakeholders to resolve discrepancies and clarify definitions, supporting the shared understanding that business leaders, data owners, and data stewards need to interpret reporting consistently.

Healthcare is where I’ve developed this experience. The skills carry across industries: understanding performance, investigating operational gaps, and making data reliable enough to support decisions.

12+ units

Recurring census and discharge reporting scope.

SQL → Power BI

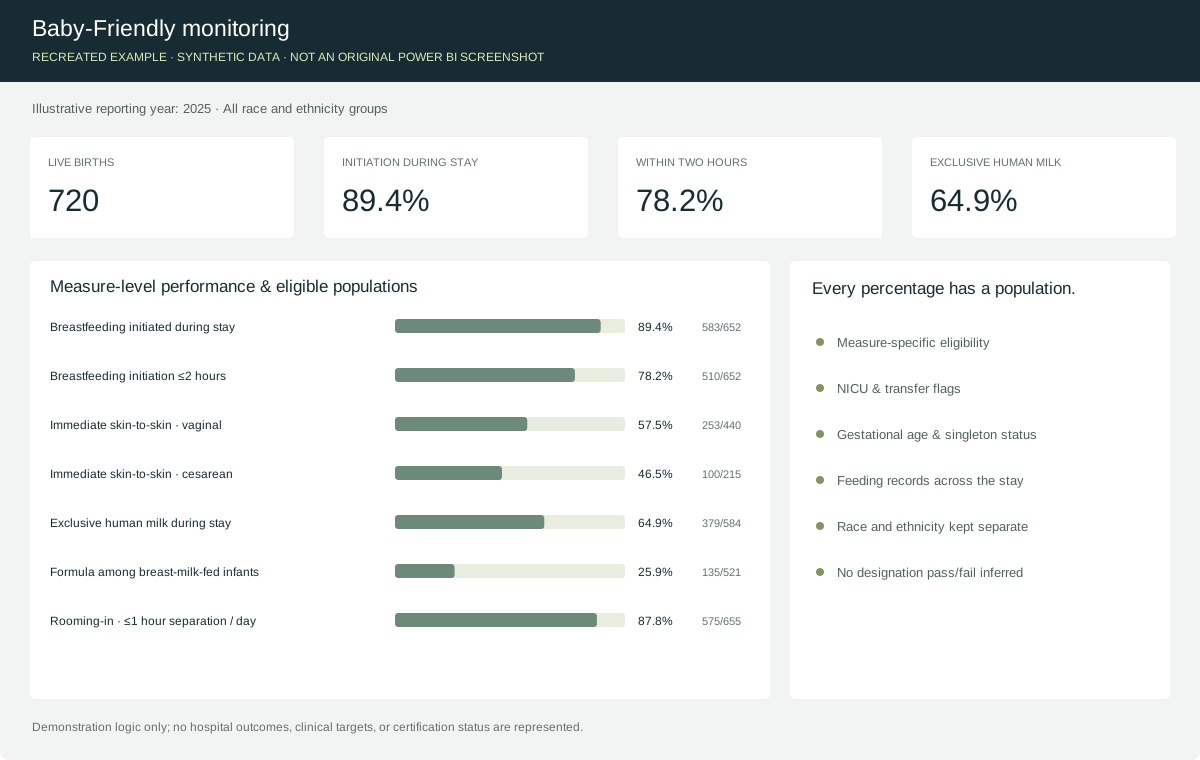
From clinical records to Baby-Friendly reporting.

10 records

Flagged 10 ambulance records with inconsistent timestamps for when crews became available for the next call.

Bachelor of Business Administration (BBA) · Major in Business Analytics
Texas A&M University–Commerce · 2021
01   Query & prepare

SQL Server / SSMS · T-SQL · CTEs & joins · Stored procedures · SSIS

02   Model & visualize

Power BI · Tableau · Epic Radar / SlicerDicer · DAX · Power Query · Data modeling & relationships · Scheduled refreshes

03   Validate & govern

Data quality validation · Source reconciliation · Metric definitions · Traceable reporting logic · Advanced Excel / PivotTables

04   Deliver & align

Stakeholder requirements · Business definitions & reporting standards · Epic Clarity / Caboodle · Reporting Workbench · SlicerDicer · Jira / Slack
03 — How I work

Useful insights start before the dashboard.

01

Define the decision

Translate stakeholder needs into clear business questions, agreed metric definitions, and decisions the reporting should support.

02

Build the foundation

Identify source systems, define the reporting grain, and build SQL datasets with traceable transformation logic.

03

Challenge the numbers

Reconcile source totals, test eligibility and date logic, and resolve data quality exceptions with stakeholders.

04

Make it usable

Present findings clearly, explain calculation rules and limitations, and refine the reporting around stakeholder use.

The next chapter

Bringing clarity to the next business question.

Interested in data and reporting opportunities where SQL, thoughtful analysis,
and clear communication make a difference.

Dallas, TX · Remote preferred